
Coming Soon
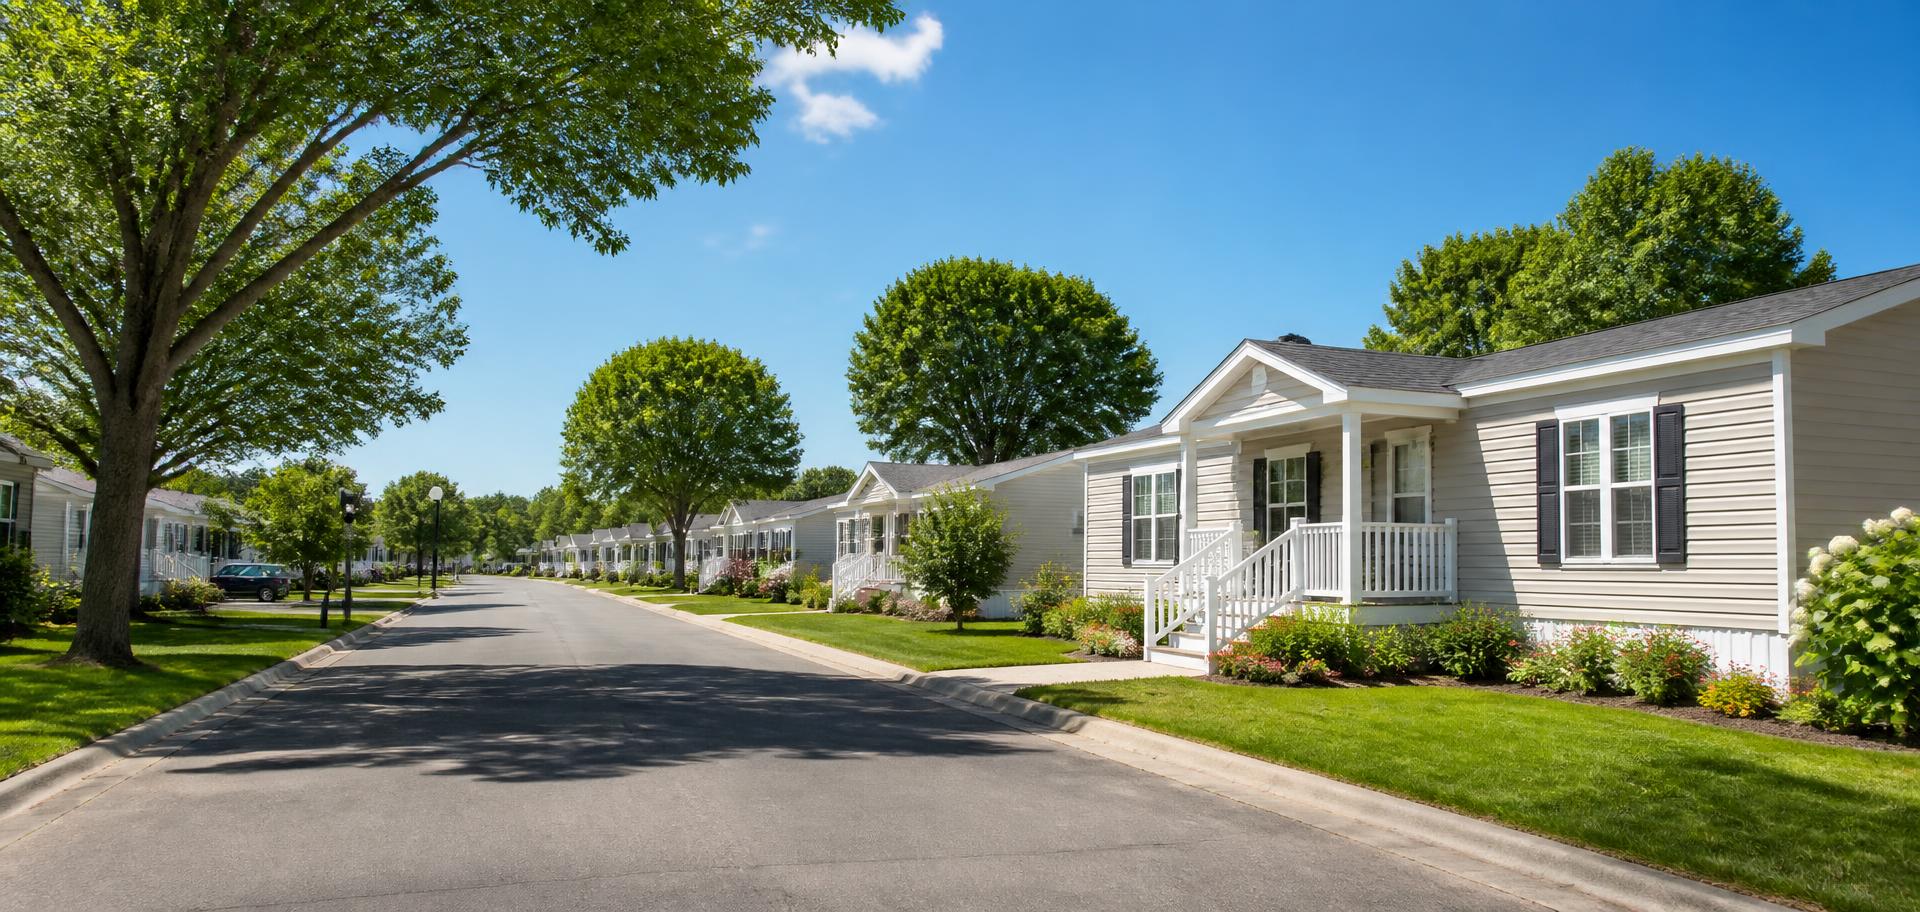
Desert Vista Community
Units148 Spaces
Acres32 Acres
LocationPhoenix Metro, AZ
Target Cashflow7.5%
Target AAR15% to 18%
Sonos Capital's principals have been acquiring, operating, and realizing real estate investments since 2002, across residential, multifamily, and manufactured housing communities. The record below is presented deal-by-deal, including the investments that did not work.
Historical Performance
Realized and partially realized investments made by the principals of Sonos Capital and affiliated entities. Results shown are historical, include investments held outside of any current fund, and are not a projection of fund level performance.
| Market | Asset Type | Acquired | Hold (yrs) | Purchase Price | Equity Invested | Cash Yield | Total Return | Equity Multiple | Annualized IRR |
|---|---|---|---|---|---|---|---|---|---|
| Avondale, AZ | Single Family Home Rental | Sept. 2002 | 2.3 | $140,000 | $14,000 | 0.0% | $163,000 | 11.64x | 9% |
| Glendale, AZ | 6 Unit Apartment | Dec. 2003 | 1.5 | $180,000 | $40,000 | 10.0% | $252,000 | 6.30x | 16% |
| Phoenix, AZ | Single Unit Loft Rental | Jan. 2003 | 4.4 | $192,000 | $19,200 | 3.8% | $309,000 | 16.90x | 6% |
| Mesa, AZ | Single Family Home Rental | Feb. 2004 | 1.0 | $160,000 | $50,000 | 0.0% | $100,000 | 2.00x | 50% |
| Phoenix, AZ | Urban Infill Lot | Aug. 2005 | 1.7 | $20,000 | $20,000 | 0.0% | $80,000 | 4.00x | 25% |
| Phoenix, AZ | New Construction Townhome | Dec. 2004 | 1.0 | $199,000 | $199,000 | 0.0% | $329,000 | 1.65x | 60% |
| Phoenix, AZ | 2 Unit Apartment | Jun. 2005 | 2.0 | $180,000 | $36,000 | 0.0% | $156,000 | 4.33x | 23% |
| Glendale, AZ | Single Family Home Rental | Jan. 2005 | 3.0 | $210,000 | $70,000 | 2.3% | $154,400 | 2.21x | 45% |
| Denver, CO | Single Unit Condo | May 2007 | 0.3 | $160,000 | $32,000 | 0.0% | $102,000 | 3.19x | 31% |
| Denver, CO | Single Unit Condo | July 2007 | 3.4 | $440,000 | $88,000 | 0.0% | $73,000 | 0.76x | -5% |
| Austin, TX | Single Family Home Rental | Nov. 2006 | 2.4 | $210,000 | $42,000 | 2.9% | $156,500 | 3.73x | 27% |
| Phoenix, AZ | Single Unit Condo | July 2005 | 4.0 | $218,000 | $21,800 | 0.0% | ($36,200) | -1.66x | N/A |
| Scottsdale, AZ | Single Unit Condo | Dec. 2006 | 2.6 | $536,000 | $53,600 | 0.0% | ($32,400) | 0.40x | N/A |
| Tucson, AZ | Duplex Rental | Sept. 2012 | 0.8 | $160,000 | $50,000 | 9.0% | $92,800 | 1.86x | 54% |
| Phoenix, AZ | Triplex Rental | Dec. 2016 | 1.7 | $135,000 | $13,500 | 0.0% | $143,500 | 10.63x | 9% |
| Phoenix, AZ | 16 Unit Apartment | Mar. 2017 | 1.0 | $975,000 | $100,000 | 0.0% | $625,000 | 6.25x | 16% |
| Yuma, AZ | 62 Space Mobile Home Park | Sept. 2014 | 0.1 | $1,000,000 | $100,000 | 0.0% | $200,000 | 2.00x | 50% |
| Phoenix, AZ | 4 Unit Apartment | Sept. 2017 | 1.7 | $305,000 | $5,000 | 0.0% | $69,000 | 13.80x | 7% |
| Southeast, AZ | 155 Space Mobile Home Park | Sept. 2017 | 3.1 | $900,000 | $430,000 | 52.3% | $2,982,250 | 6.94x | 19% |
| Casa Grande, AZ | Duplex Rental | Sept. 2012 | 0.5 | $90,000 | $12,000 | 0.0% | $62,000 | 5.17x | 19% |
| Totals / Averages | 1.9 | $6,410,000 | $1,396,100 | 8.1% | $5,980,850 | 4.34x | 26% | ||
Weighted average yield and IRR are weighted on sum of fair value and distributions. Total capital includes all investors, both Sonos Capital entities and other investors. Past performance is not indicative of future results.
* Equity multiples shown are calculated as total proceeds divided by equity invested. Losses are expressed as a positive proceeds multiple (for example, an asset where $53,600 of equity returned $21,200 of proceeds is shown as 0.40x). Annualized IRRs are supplied by the sponsor based on actual dated cash flows and may not be directly derivable from the summary columns above.
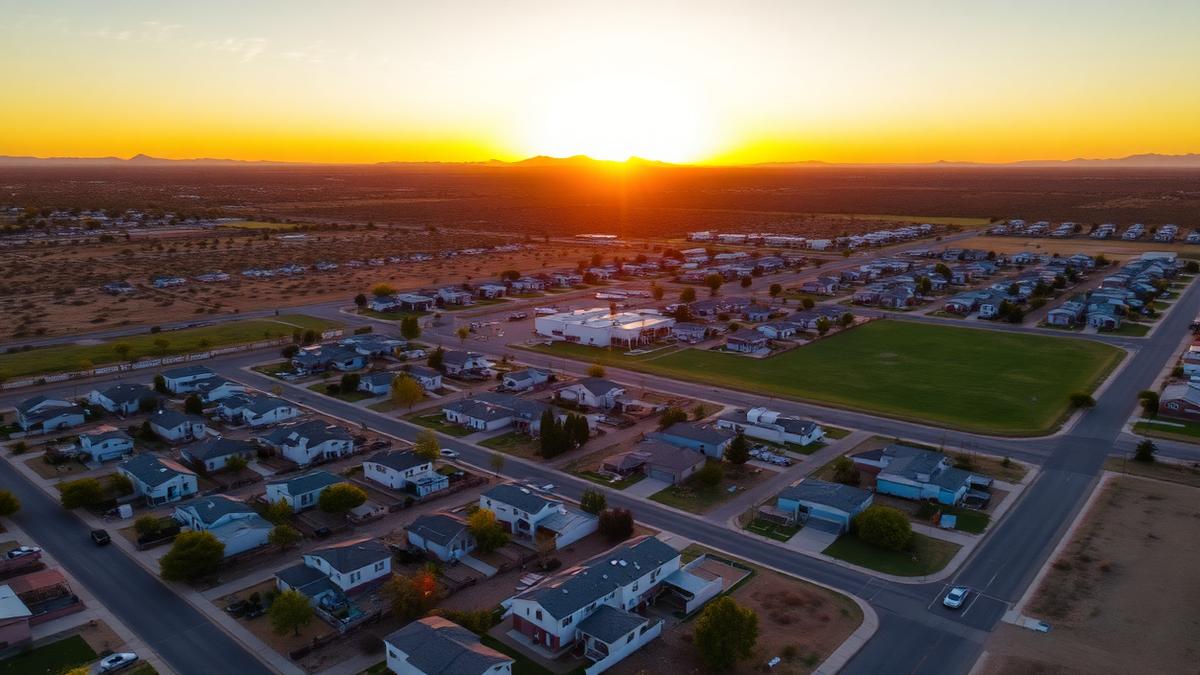
Our current and actively evaluated manufactured housing communities, including market, structure, return of capital, and long term asset hold.

Portfolio and Reporting
Sonos Capital targets quarterly distributions to investors. Distributions are not guaranteed. Whether a distribution is made, and in what amount, depends on property level performance, available cash flow, reserve requirements, debt obligations, and the discretion of the manager. Distributions may be reduced, suspended, or discontinued at any time, and no past or targeted distribution should be relied on as an indication of future results.
The schedule below is a target processing schedule only. Each distribution is targeted for the middle of the month shown and relates to the prior operating period indicated. Payments falling on a weekend or holiday are processed on the next business day. This schedule is not a commitment to declare a distribution.
Target Distribution Schedule
Target Distribution Schedule
Investment Philosophy
We underwrite to current in-place performance rather than to projected rent growth, and we are prepared to pass on transactions that do not meet our criteria.
Value is created through occupancy, collections, infill, infrastructure, and resident retention, not through leverage or financial engineering.
Conservative debt structures, funded reserves, and landlord-friendly markets are weighted ahead of aggressive growth assumptions.
Quarterly investor updates, annual K-1s, and audited financials, including results that fall short of plan.
FAQ
Sonos Capital's approach to proactive communication helps provide investors with answers to questions before they arise.
Yes, depreciation benefits may pass through to investors depending on fund structure and tax treatment.
Cost segregation studies are performed strategically to maximize depreciation benefits.
Properties are managed internally through dedicated operational teams.
Depreciation is allocated proportionally according to investor ownership interests.
Past performance is not indicative of future results. The historical results shown on this page relate to prior investments made by the principals of Sonos Capital and affiliated entities, many of which were made outside of any current offering and under different market, financing, and structural conditions. They are provided for background only and should not be interpreted as a projection or guarantee of the performance of any current or future offering.
Targeted distributions and targeted K-1 delivery dates are objectives, not promises. Distributions depend on property performance, available cash flow, reserves, lender requirements, and manager discretion, and may be reduced, suspended, or discontinued.
Private real estate investments are illiquid and speculative and involve substantial risk, including the possible loss of principal. Nothing on this page is an offer to sell or a solicitation of an offer to buy any security. Any offering is made solely pursuant to a Private Placement Memorandum and related documents, which should be reviewed with your own legal, tax, and financial advisors.
Schedule a Meeting
Book a personal call with our investor relations team to review the track record, discuss our strategy, and answer your questions.